The financial institution in brief:
BNP Paribas Asset Management is the investment management arm of BNP Paribas, one of the world’s major financial institutions. Managing and advising EUR 569 billion in assets as at 31 December 2017, BNP Paribas Asset Management (BNPP AM) offers a comprehensive range of active, passive and quantitative investment solutions covering a broad spectrum of asset classes and regions. With more than 700 investment professionals and around 600 client servicing specialists, BNPP AM serves individual, corporate and institutional investors in 70 countries around the world.
Since 2002, BNPP AM has been a major player in sustainable and responsible investing, with EUR 35 billion in SRI assets and EUR 230 billion of assets that take into account ESG criteria as at 31 December 2017. Today, BNPP AM has a dedicated multi-disciplinary team of 11 ESG professionals within the Sustainability Centre, with financial, economic and legal expertise.
BNPP AM is a member of advisory committees at international bodies such as the PRI, the IIGCC and the FAO/OECD. BNPP AM was ranked first-in-class (A+) by PRI for its approach to responsible investing.
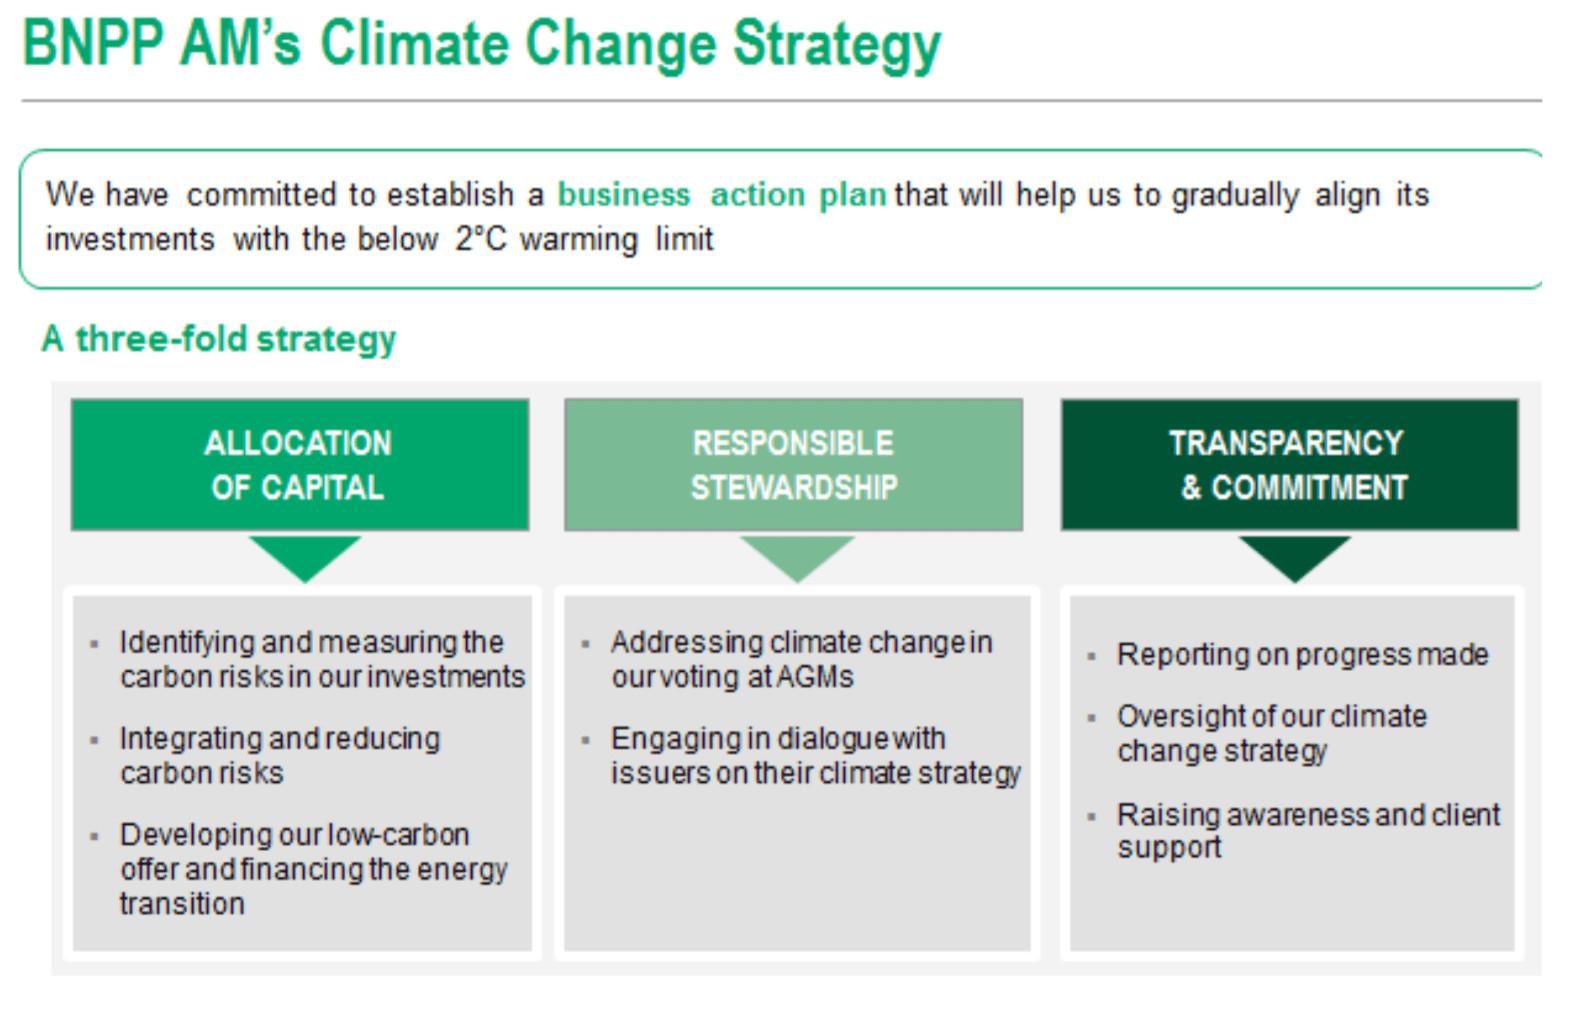
BNPP AM has adopted a climate change strategy which relies on three pillars:
- allocation of capital
- responsible stewardship
- transparency & commitment.
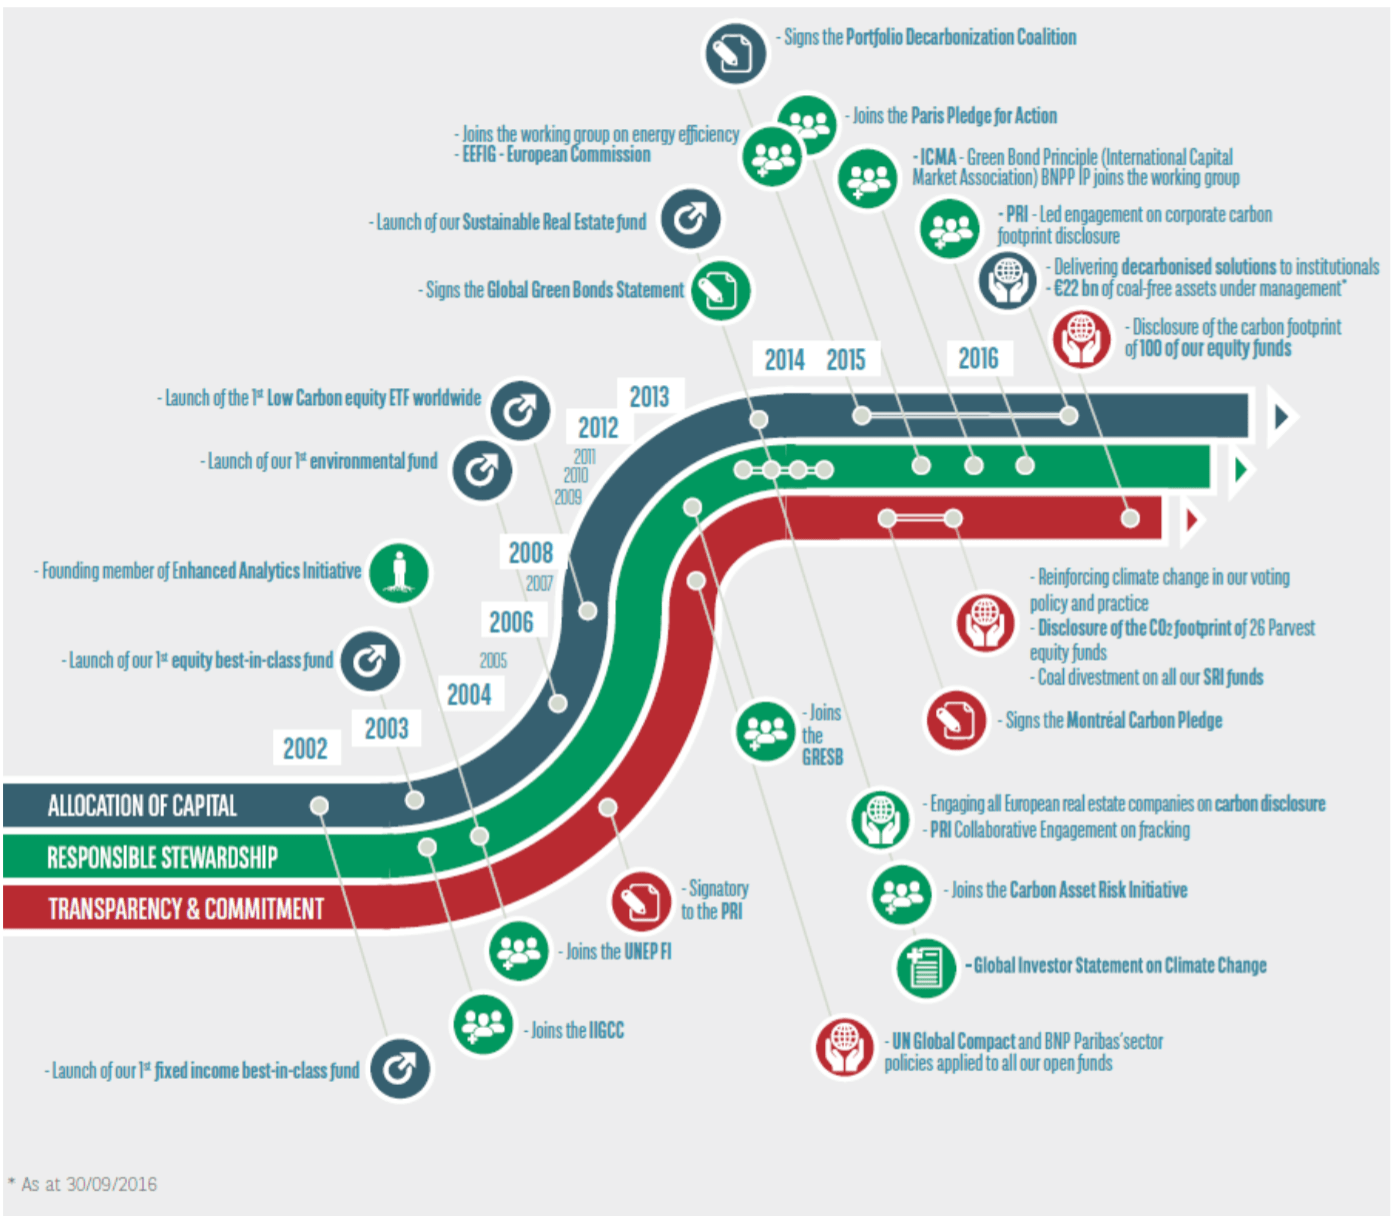
Over the last 15 years, BNPP AM has been looking at climate change as a whole, but over the last four years, we have seriously scaled up our efforts related to tackling global warming.
Since its participation in the Natural Capital and the Finance Sector Workshop in London in July 2017, natural capital has gained momentum within BNPP AM.
Two members of the ESG team explained why natural capital matters to responsible investors during a “Wake-Up Call” at Novethic’s annual ESG Strategies for Responsible Investors Conference in December 2017 which gathers major asset owners from across Europe.
To raise awareness within BNPP AM, a conference on natural capital was held at its Paris office in February 2018, with the participation of Erik Orsenna, member of the Académie Française.
Why use natural capital thinking?
BNPP AM wants first to map its natural capital impact drivers and/or dependencies to better manage the associated risks and opportunities, with the ultimate goal of limiting its natural capital footprint. But BNPP AM also knows that it is too early to measure the impact drivers and/or dependencies across all portfolios.
BNPP AM is currently discussing the possibility of building on the work done on climate change and replicating/extending it to other impact drivers and/or dependencies such as water.
This is why BNPP AM has started to map its natural capital dependencies to find the natural capital hotspots of its investments so that they can be disclosed to clients and other stakeholders. Therefore, BNPP AM wants to engage with companies to increase their level of disclosure on natural capital. This is still low today.
Besides, ESG data providers have not yet captured all the natural capital dependencies and impacts of companies. BNPP AM wants to strengthen its ESG analysis of companies, which is based on sectors, to better assess risks and opportunities. And as BNPP AM’s ESG scores are disseminated to all portfolio managers, BNPP AM will have the possibility to raise awareness with its fund managers to better inform their investment decisions.
What was the approach?
Objective
The aim of our assessment was twofold:
- analyse the water management of all the European companies in the materials sector that are constituents of the MSCI Europe and the Barclays EUR Aggregate indices (but not only) and integrate this assessment into BNPP AM’s ESG scores
- engage as many companies as possible in one-to-one dialogues on their water management
BNPP AM’s ESG scores (absolute ESG score) and deciles (relative ESG ranking, sector neutral) are disseminated to all portfolio managers and applied in this way:
- For the SRI best-in-class funds, portfolio managers cannot invest in the bottom three ESG deciles.
- For the SRI thematic funds, portfolio managers cannot invest in the bottom ESG decile.
- For the non-SRI funds, portfolio managers use ESG scores in their risk management and/or can have fund-specific ESG constraints/rules (such as overweight the top ESG deciles, underweight the bottom ESG deciles, exclude the bottom deciles, etc.).
Scopes
Scope A
We did a first assessment in June 2017 in which we analysed 42 European companies from these sub-sectors: chemicals, agrochemicals, metals, construction materials, pulp and paper, packaging.
We engaged with 13 companies to assess their water management in one-to-one conversations.
Scope B
A second assessment was done in February 2018 in which we analysed seven European mining companies.
We engaged with four companies to assess their water management in one-to-one conversations.
Data
We used a combination of primary and secondary data:
- from companies (websites, CSR reports, annual reports, one-to-one conversations)
- from BNPP AM’s ESG data providers
- from mainstream and SRI brokers
- from civil society/NGOs such as CDP, WWF, etc.
- from international/industry bodies such as UN CEO Water Mandate, World Resource Institute, WBCSD, WHO, FAO/AQUASTAT, ICMM, etc.
Assessment
Scope A
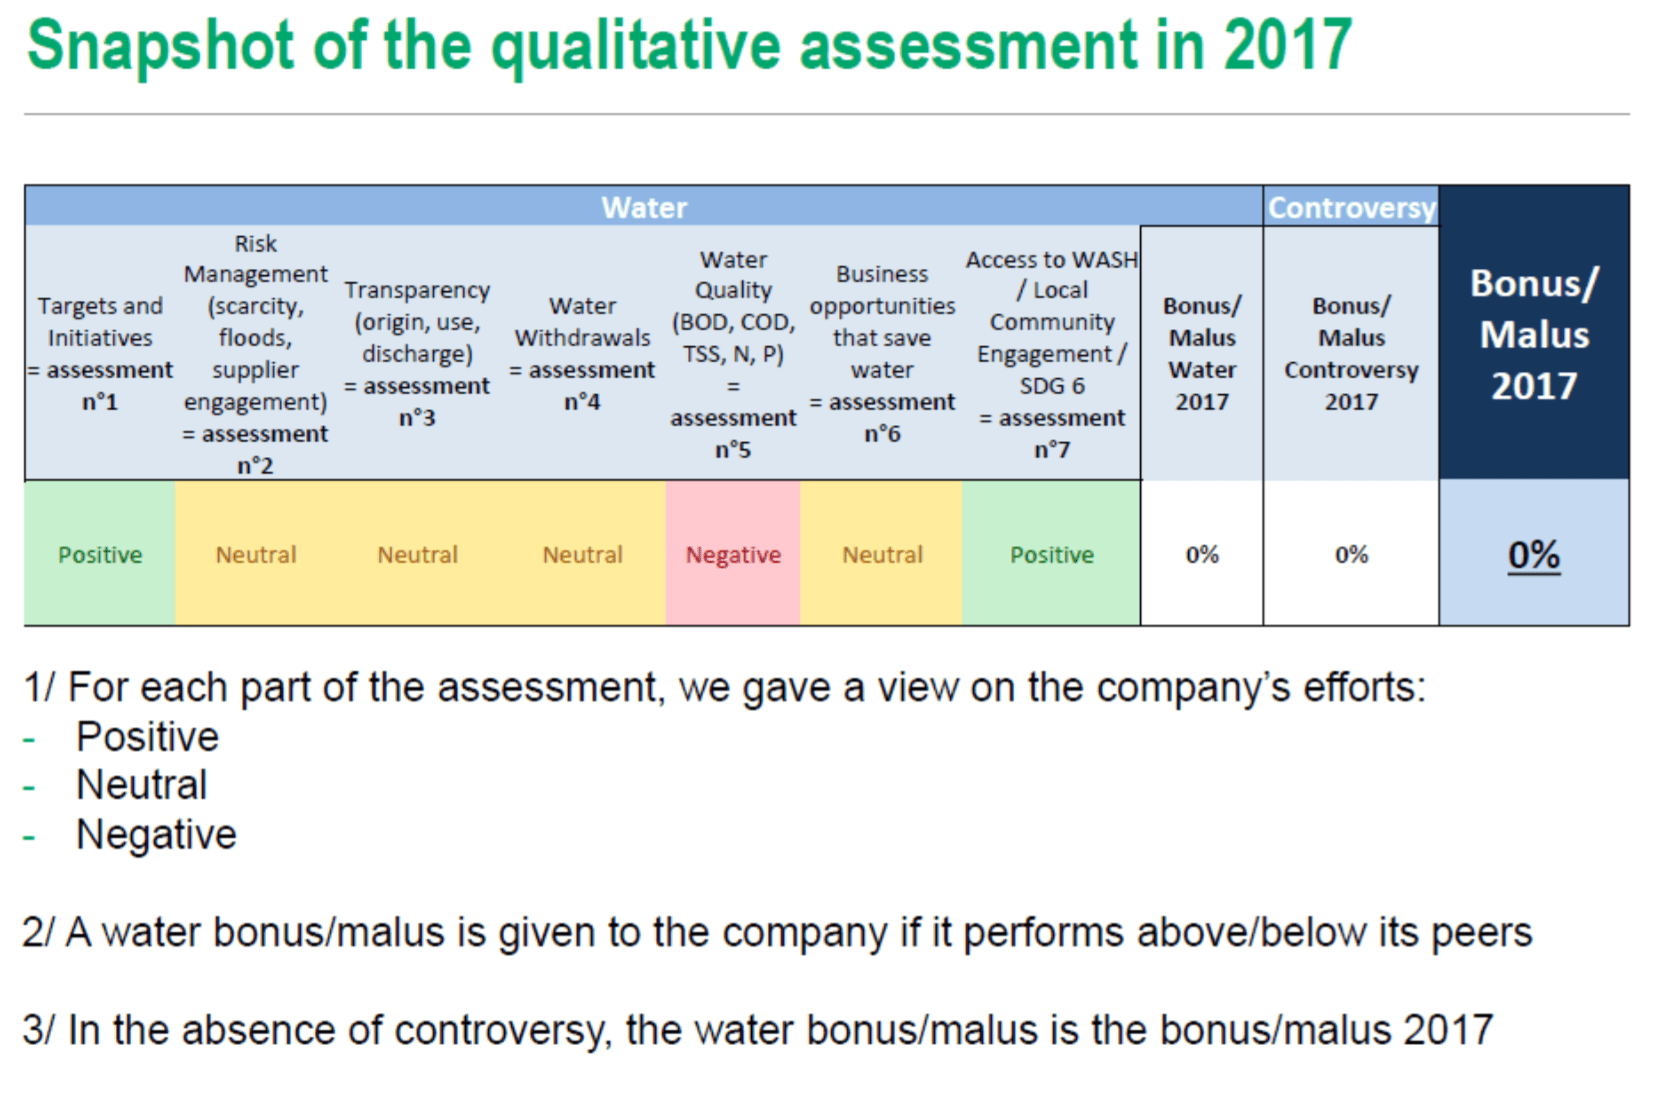
In this analysis, we made a qualitative assessment of the company’s efforts on seven criteria:
- Targets and initiatives
- Risk management (scarcity, floods, supplier engagement)
- Transparency (origin, use, discharge)
- Water withdrawals performance
- Water quality (BOD, COD, TSS, N, P) performance
- Business opportunities that save water
- Access to WASH / Local Community Engagement / SDG 6.
The below slide summarises the assessment:
Scope B
The assessment of water management and performance for the mining industry was less deep than for scope A. More work is required. But it has provided us with a good working base for engagement with the sector in the coming years.
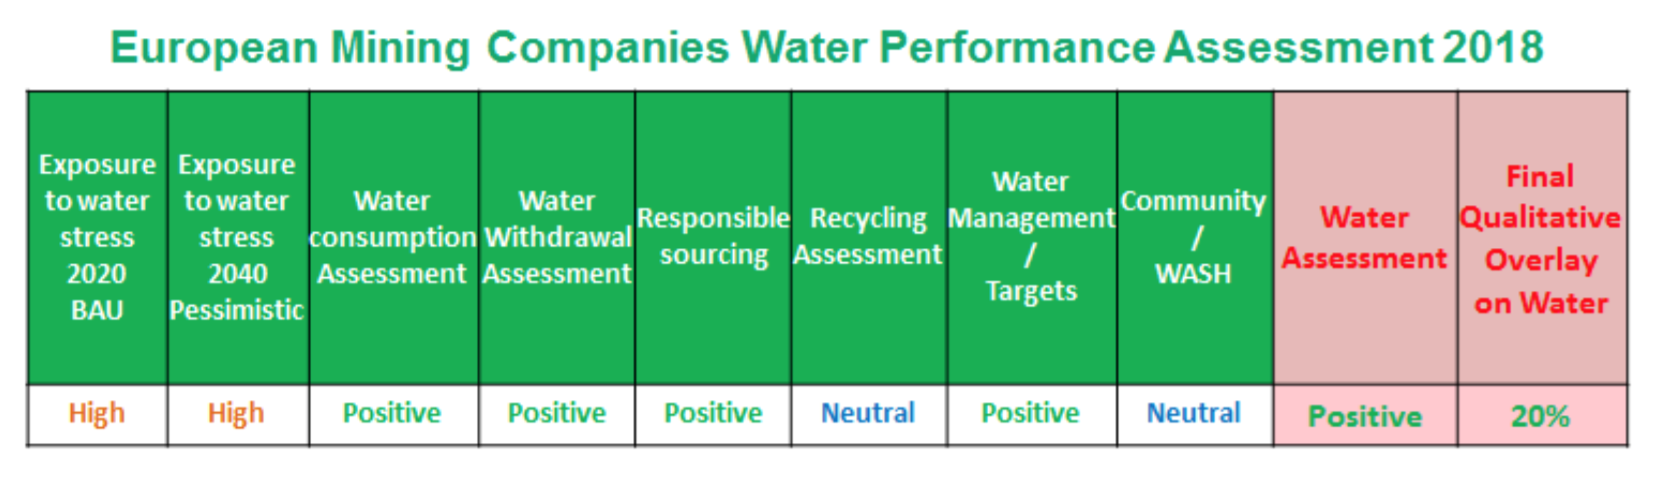
In this analysis, we made a qualitative assessment of the company’s efforts on eight criteria:
- Exposure to water stress 2020 BAU
- Exposure to water stress 2040 pessimistic
- Water consumption
- Water withdrawal
- Responsible sourcing
- Recycling
- Water management / targets
- Community / WASH.
- The below slide summarises the assessment:
What were the outcomes of the assessment?
General outcomes:
Assessment n°1: Water targets and initiatives
KPIs
- Initiatives: ex. signatory of CEO Water Mandate, Water Footprint Network, ICMM Water Working Group, Global Alliance for Climate Smart Agriculture, International Agri-Food Network, WBCSD, etc.
- Targets: ex. lower water withdrawals, lower COD, context-based targets
Companies have not yet completely integrated water as part of their decision- making: water should be a strategic issue. We engaged with companies on context-based thinking.
Assessment n°2: Water risk management
KPIs
- Governance: ex. expert groups, responsibility chain
- Data & monitoring: ex. WRI Aqueduct, WBCSD Global Water Tool, Ecolab Water Risk Monetizer, GEMI Local Water Tool, Maplecroft Global Water Security Risk Index, Life-Cycle-Analysis
- Risk identification: ex. basin hotspots, scarcity, tailings, compliance
- Supplier engagement: ex. EcoVadis Scorecards/TfS Audits, Supplier Code of conduct, etc.
- Certifications: ex. 3rd party verification, ISO 14001.
Overall, almost all the companies in our coverage report on their water risk management.
- Water stress: we found only a few companies that have not mapped their direct exposure. The next step is to map their suppliers.
- Floods: we would expect more disclosure and policies from companies on flood risk. Mining companies are better prepared.
- Regulation: companies expect higher compliance and license-to-operate costs.
Price of water: companies that are integrating a water price in their decision-making are better prepared.
Assessment n°3: Water transparency
KPIs:
- Reporting: ex. ISO 14046
- Use: explanation of water use by process/product
- Origin/consumption/discharge: ex. breakdown by origin, breakdown of consumption, breakdown of discharge, breakdown of recycling
- Price of water: internal price of water.
Harmonisation of accounting methods is key to understanding how the companies are measuring their water use and promoting water efficiency.
Companies should enhance their water disclosures:
- Some companies are working towards ISO 14046 reporting
- Basin-by-basin details
- Water quality indicators
- Indirect water footprint (“scope 3”).
Assessment n°4: Water withdrawals/consumption
KPIs:
- Ex. % production sites located in water stress areas, % water withdrawals in water stressed areas, % of watersheds meeting all – withdrawal targets (> 40% of renewable supplies, according to WRI).
As comparability is difficult between companies on withdrawals and consumptions figures, we focused particularly on:
- Water (absolute and specific) intake trends
- Share of freshwater vs. groundwater used
- Reasons behind higher/lower intake
- Recycling rates.
We engaged with companies on fossil water.
Assessment n°5: Water quality
KPIs:
- % of watersheds meeting all water quality targets
- Ex. Total Suspended Solid (TSS), Biological Oxygen Demand (BOD), Chemical Oxygen Demand (COD), Nitrogen loading (N), Phosphorus loading (P)
- Untreated wastewater discharge.
It can be difficult to assess performance as water quality is a site-specific issue which makes for low comparability. Companies strive to be ‘compliant’ (which involved a more passive than proactive approach).
Water quality is heavily regulated (EU Water Framework Directive or equivalent) and site/basin-specific. We assessed companies based on:
- Water discharge(absolute and specific) trends
- Reason behind higher/lower discharges
- Transparency/CAPEX/OPEX efforts.
Assessment n°6: Business opportunities that save water
We found a lot of interesting solutions provided by companies, but nothing material in terms of revenue exposure.
Assessment n°7: Contribution to SDG 6
KPIs
- Providing access to WASH for employees and/or suppliers
- Providing access to WASH in local communities
- Local community engagement.
Few companies in our coverage committed to improving access to WASH for their employees (WASH pledge). Next step: WASH in supply chain. Indeed, out of the 139 global materials companies that we scored, only eight (of which six in Europe) had signed the WASH at the Workplace pledge.
Water budget, ”Fair Share”, “Sufficiency”: companies are at a very early stage of awareness.
Company-specific outcomes:
The outcome of the analysis was a bonus/malus ranging from -30% to +30% which was applied to the company’s ESG score.
- Three European chemicals companies out of 20 were given a bonus to reflect their sustainable water management; four were given a malus due to inadequate risk management and transparency.
- Four European agrochemicals companies out of five were given a malus to reflect their poor transparency and water quality performance: such companies contribute globally to eutrophication as their products are rich in nitrates and phosphates.
- One European construction materials company out of four was given a bonus as it adopted ambitious targets to reduce specific freshwater withdrawal in cement operations and to demonstrate a positive impact by 2030 on water resources in water-scarce areas.
- One European metals company out of seven was given a bonus, while two received a malus.
- Two European paper & packaging companies out of six were given a bonus.
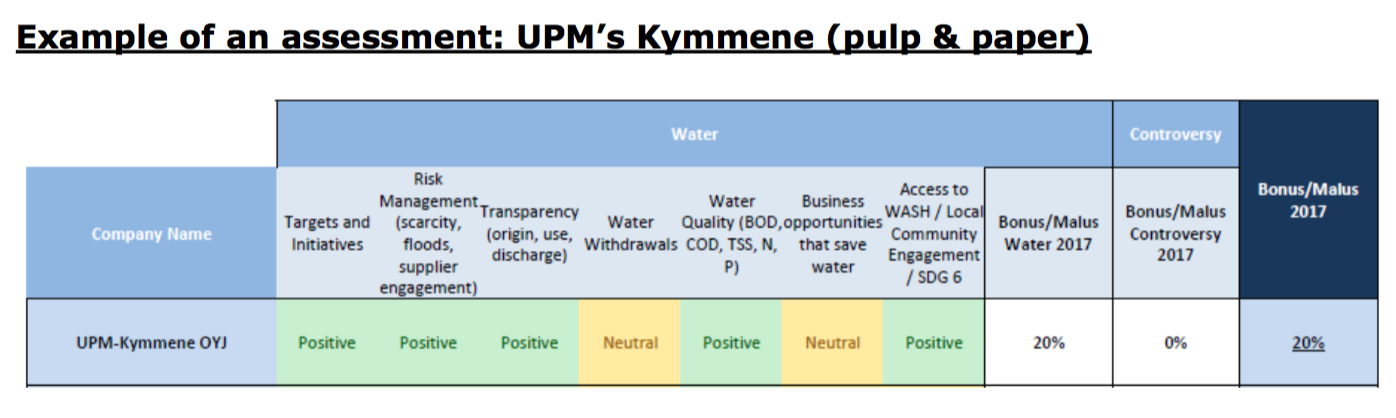
UPM’s overall performance in the overlay: 20% bonus in 2017
UPM’s dedication to water management and disclosure is outstanding. The company has set three ambitious water targets for 2030 against a 2008 baseline at group level for pulp and paper production:
1/ reduce effluent load (COD) by 40% (achieved -27% in 2016)
2/ reduce wastewater volume by 30% (achieved -13% in 2016)
3/ 100% of nutrients used in effluent treatment from recycled sources (started the project in 2016).
Its water quality monitoring systems are strong and the company has implemented both mechanical and biological effluent treatment at all its sites. Interestingly, it is working with Yara to meet its promising nutrient recycling target. Also, it is working with local authorities to assess its local impact on watersheds: for example, it has reported a 10-year study on its low impact on the Uruguay river, which was confirmed by Argentinian and Uruguayan authorities.
In terms of risk management, the company says it operates at 100% in water- abundant locations (it discloses publicly the location of its production sites on Water Stress Index maps, which is clearly best practice). Also, it is the only company assessed which has disclosed a water sensitivity analysis.
Finally, UPM is the only company among peers that has committed to promoting access to safe drinking water, proper sanitation facilities and good hygiene. It signed the WBCSD WASH at the Workplace pledge: it will provide all employees with safe water and sanitation no later than 2018.
Scope B
General outcomes:
Assessment n°1 & 2: Exposure to water stress
KPIs
- Weighted average score based on the breakdown of EBITDA by country and the water stress score of each country of implementation
Companies are very aware of their exposure to water stress, but the way they communicate on it is clearly not harmonised: % of facilities vs. % of water abstracted, water risk vs. water stress. The assessment is complicated.
We used the model developed by Bernstein* to assess the exposure of each mining company to water stress as of today (based on WRI Aqueduct Water stress 2020 BAU) and in a 2040 Pessimistic Scenario (based on WRI Aqueduct Water stress 2040 Pessimistic). Exposure to water stress varies from one company to the next and knowing the individual company’s exposure to water scarcity helps to assess water management quality.
Assessments n°3, 4, 5 & 6: Water withdrawals / consumption
KPIs
- Water (absolute and specific) intake
- Origin of water used
- Recycling rates
Limiting freshwater withdrawal and developing strategies around the use of brackish or sea water is considered best practice. The assessment is qualitative and takes into account the local context.
Reporting on water consumption and water withdrawal remains inconsistent among companies as definitions are not harmonised. Harmonising accounting rules is required to help investors assess more precisely mining companies’ water risk exposure and performance.
Assessment n°7: Water management / targets
KPIs
- Water-related targets: ex. absolute water withdrawal reduction, increase share of brackish or recycled water, reduce freshwater use
- Management of water at catchment level
Assessment n°8: Community / WASH
KPIs
- Providing access to WASH for employees and/or suppliers
- Providing access to WASH in local communities
- Local community engagement.
Food for thought:
Surprisingly enough mining companies do not report any information on water quality discharge. This could be an area of active engagement taking into account the potentially massive impacts of mining activity on watersheds.
Company-specific outcomes:
- Three European mining companies out of seven were given a bonus to reflect their sustainable water management. Two were given a malus because of inadequate water withdrawal and transparency.
Communication:
BNPP AM shared the outcomes with its institutional clients (mandates). BNPP AM is starting now to disclose more to stakeholders such as civil society (this case study being one example).
Next steps
In a similar way, we have analysed in the past year:
- the climate change and forest policies of companies in the consumer staples sector
- the climate change and air pollution impacts of European companies in the Automobile sector
- the climate change and air pollution impacts of European companies in the utilities sector
- the natural capital dependencies and impacts (climate change, forest, water, biodiversity and land-use) of European companies in the financials sector
- the climate change and biodiversity policies of European companies in the mining sector.
We are currently assessing the materials sector again, this time not on water, but other on natural capital dependencies and impacts (climate change, waste, forest, air pollution, land-use and biodiversity).
*Bernstein’s publication: ESG: Metals & Mining – The threat of water scarcity in the mining industry, 29 June 2017