Explore the resources below to assist in completing this action.
Biodiversity Guidance action 6.2.4
6.2.4 Select methods for measuring change
Data requirements will change based on selected measurement methods and need to be reviewed in each instance. You should also bear in mind that actions 5.2.3 through 6.2.4 can be used iteratively to ensure that data and methods are compatible.
For example, measurement methods using primary biodiversity data usually involve on-the-ground data collection. If budget, time restrictions, or the objective of your assessment do not allow for the use of primary data, then secondary data can be used instead. Using secondary data, such as on climate change, land use, and pollution, can allow you to model biodiversity impacts through a variety of methods. However, modeled results often convey less detail. Table 6.2 provides additional biodiversity-specific considerations for the use of primary and secondary biodiversity data. For a detailed appraisal of the suitability and potential accuracy of different techniques, refer to the Protocol.
Type of data | Biodiversity-specific considerations |
Primary data | Challenges to consider when collecting primary biodiversity data: Timescales – data collected may not span the time required for impacts on biodiversity to manifest Seasonal variations – biodiversity can vary across seasons, therefore full impacts may not be captured if data are limited seasonally. Primary data collection will need to be planned so it is completed in relevant seasons (for example breeding bird surveys) Spatial variations – data may not be collected over an appropriate spatial scale to incorporate many impact drivers Technical expertise is often required such as from biology/ecology consultancies, non-governmental organizations, or academia. Other challenges more broadly applicable to primary data collection include:
|
Secondary data | Challenges to consider when utilizing secondary data: Data required are often location-specific and complex Data gaps result in the use of data assumptions, which decrease accuracy Models of the distribution of biodiversity, and of the effects of impact drivers, are often not robust enough for reliable assessments Underlying assumptions and limitations need careful consideration to ensure the modeling scenario is appropriate for your situation — often models are built for other purposes and are not applicable to new circumstances Some models require expertise to be used effectively Proprietary rights of data sources must be considered as biodiversity data are sometimes restricted for commercial use |
Other specific limitations will exist for each method reviewed, and these limitations need to be considered in the greater context of your assessment. Refer to the EU Business @ Biodiversity Assessment report and associated annexes for further explanation of issues related to data and specific limitations/applicability for each method. Examples of various measurement and estimation methods are provided in table 6.3.
Measuring changes in biodiversity | Direct measurement | Proxies | Modeling methods |
Species | Direct measurement of species richness and abundance through field surveys. Organizational Focus: product, project, site, company | Use of the Integrated Biodiversity Assessment Tool (IBAT) to identify the presence of IUCN Red List threatened species. This includes freshwater species that are present upstream and downstream of a specified water basin. Organizational Focus: project, company | Use of GLOBIO model to estimate the mean species abundance (MSA) change as a result of a given impact driver. Use of species specific habitat suitability models to estimate changes in the likelihood that local populations of species will persist after land use change (Durán et al. 2020) Organizational Focus: site/sector/portfolio |
Habitat | Direct measurement of habitat area and assessment of quality through field surveys. Organizational Focus: site, project | Use of the Integrated Biodiversity Assessment Tool (IBAT) to identify the presence of Key Biodiversity Areas and Critical Habitat in terrestrial and freshwater habitats. Use of Ocean+ data to identify the presence and extent of key marine and coastal habitats. Use of Global Mangrove Watch to download data and identify mangrove extent by region. The Defra biodiversity metric provides a method for estimating habitat quality and extent. Organizational Focus: project, company | Use of Global Forest Watch to obtain data on deforestation and forest biodiversity intactness in area/region of interest. Organizational Focus: site, project |
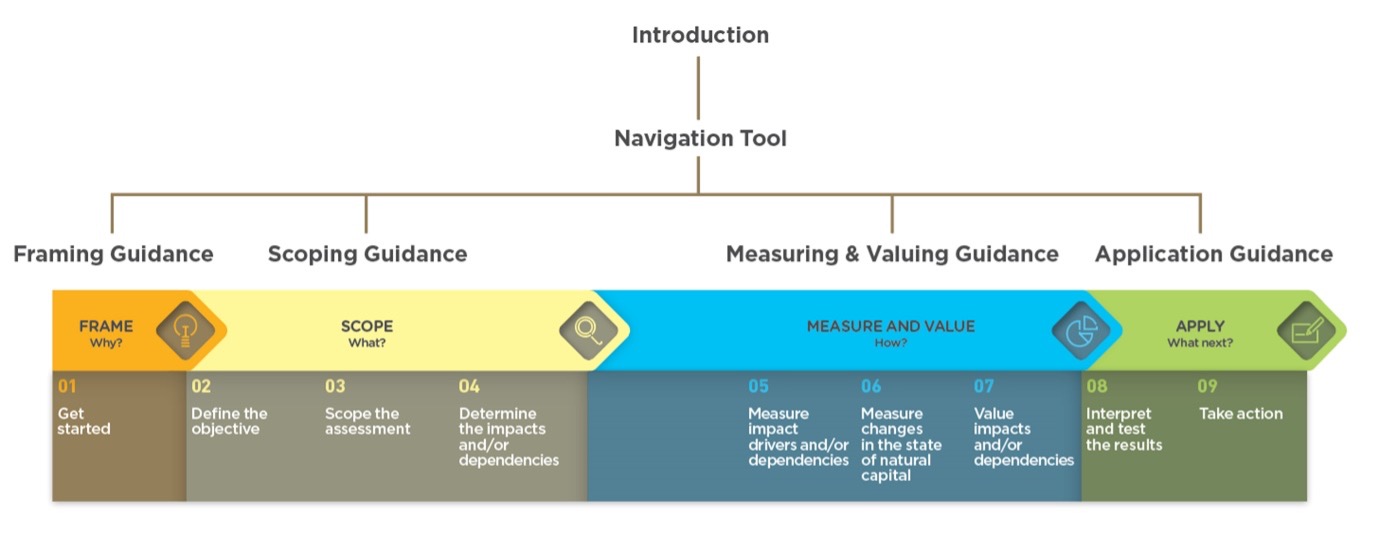
Several biodiversity measurement approaches for business are under development globally. Here, we define “measurement approaches” as encompassing indicators, frameworks, and tools for assessing corporate biodiversity impacts and dependencies. The majority are currently in the piloting phase (see figure 6.1 and box 6.1). They are currently classified by Business Application (see Framing Guidance) and Organizational Focus (see Scoping Guidance), but these are indicative and not restrictive.
Box 6.1: Aligning Biodiversity Measures for BusinessThe Aligning Biodiversity Measures for Business collaboration, in conjunction with the EU Business @ Biodiversity platform, aims to provide clarity on available corporate biodiversity measurement approaches. The partners are working to develop a systematic means of determining the most appropriate measurement approach for any biodiversity-inclusive natural capital assessment. Refer to the EU Business @ Biodiversity Assessment (Update Report 2, 2019) for description of the current methods available (as of December 2019), the data required to use each approach, and associated limitations. The Business Applications identified by the collaboration have been used within this Guidance. The matrix in table 6.1 has been developed to visualize the available measurement approaches and their applicability across the value chain. The information included in the matrix is self-reported by the measurement approach developers, and the EU Business @ Biodiversity platform is assessing various case studies from piloting of these methods to determine the validity of this self-assessment (results expected end of 2020). For this reason, the matrix may be updated as the collaboration continues to convene method developers and expand beyond the approaches identified below. It is suggested that you review all applicable approaches, and choose the one most suited to your business needs.
The Aligning Biodiversity Measures for Business collaboration, in conjunction with the EU Business @ Biodiversity platform, aims to provide clarity on available corporate biodiversity measurement approaches. The partners are working to develop a systematic means of determining the most appropriate measurement approach for any biodiversity-inclusive natural capital assessment. Refer to the EU Business @ Biodiversity Assessment (Update Report 2, 2019) for description of the current methods available (as of December 2019), the data required to use each approach, and associated limitations. The Business Applications identified by the collaboration have been used within this Guidance. The matrix in table 6.1 has been developed to visualize the available measurement approaches and their applicability across the value chain. The information included in the matrix is self-reported by the measurement approach developers, and the EU Business @ Biodiversity platform is assessing various case studies from piloting of these methods to determine the validity of this self-assessment (results expected end of 2020). For this reason, the matrix may be updated as the collaboration continues to convene method developers and expand beyond the approaches identified below. It is suggested that you review all applicable approaches, and choose the one most suited to your business needs.
You may need to adopt multiple approaches to provide a comprehensive assessment. Additionally, the combination of measurement approaches that works for one organization may not be relevant for another. Once measurement approaches have been selected, the Guidance presented here will assist you in data collection, measurement, and valuation of your business’s impacts on biodiversity. Choosing an appropriate measurement approach is also described in more detail below.
It is noted that the measurement approaches identified below (see figure 6.1) are primarily used for determining impacts and dependencies with regard to terrestrial biodiversity. It is recognized that these approaches are limited in addressing and incorporating aquatic (freshwater) and marine biodiversity (see table 10 of the EU Business @ Biodiversity Assessment Update Report 2 (2019)).
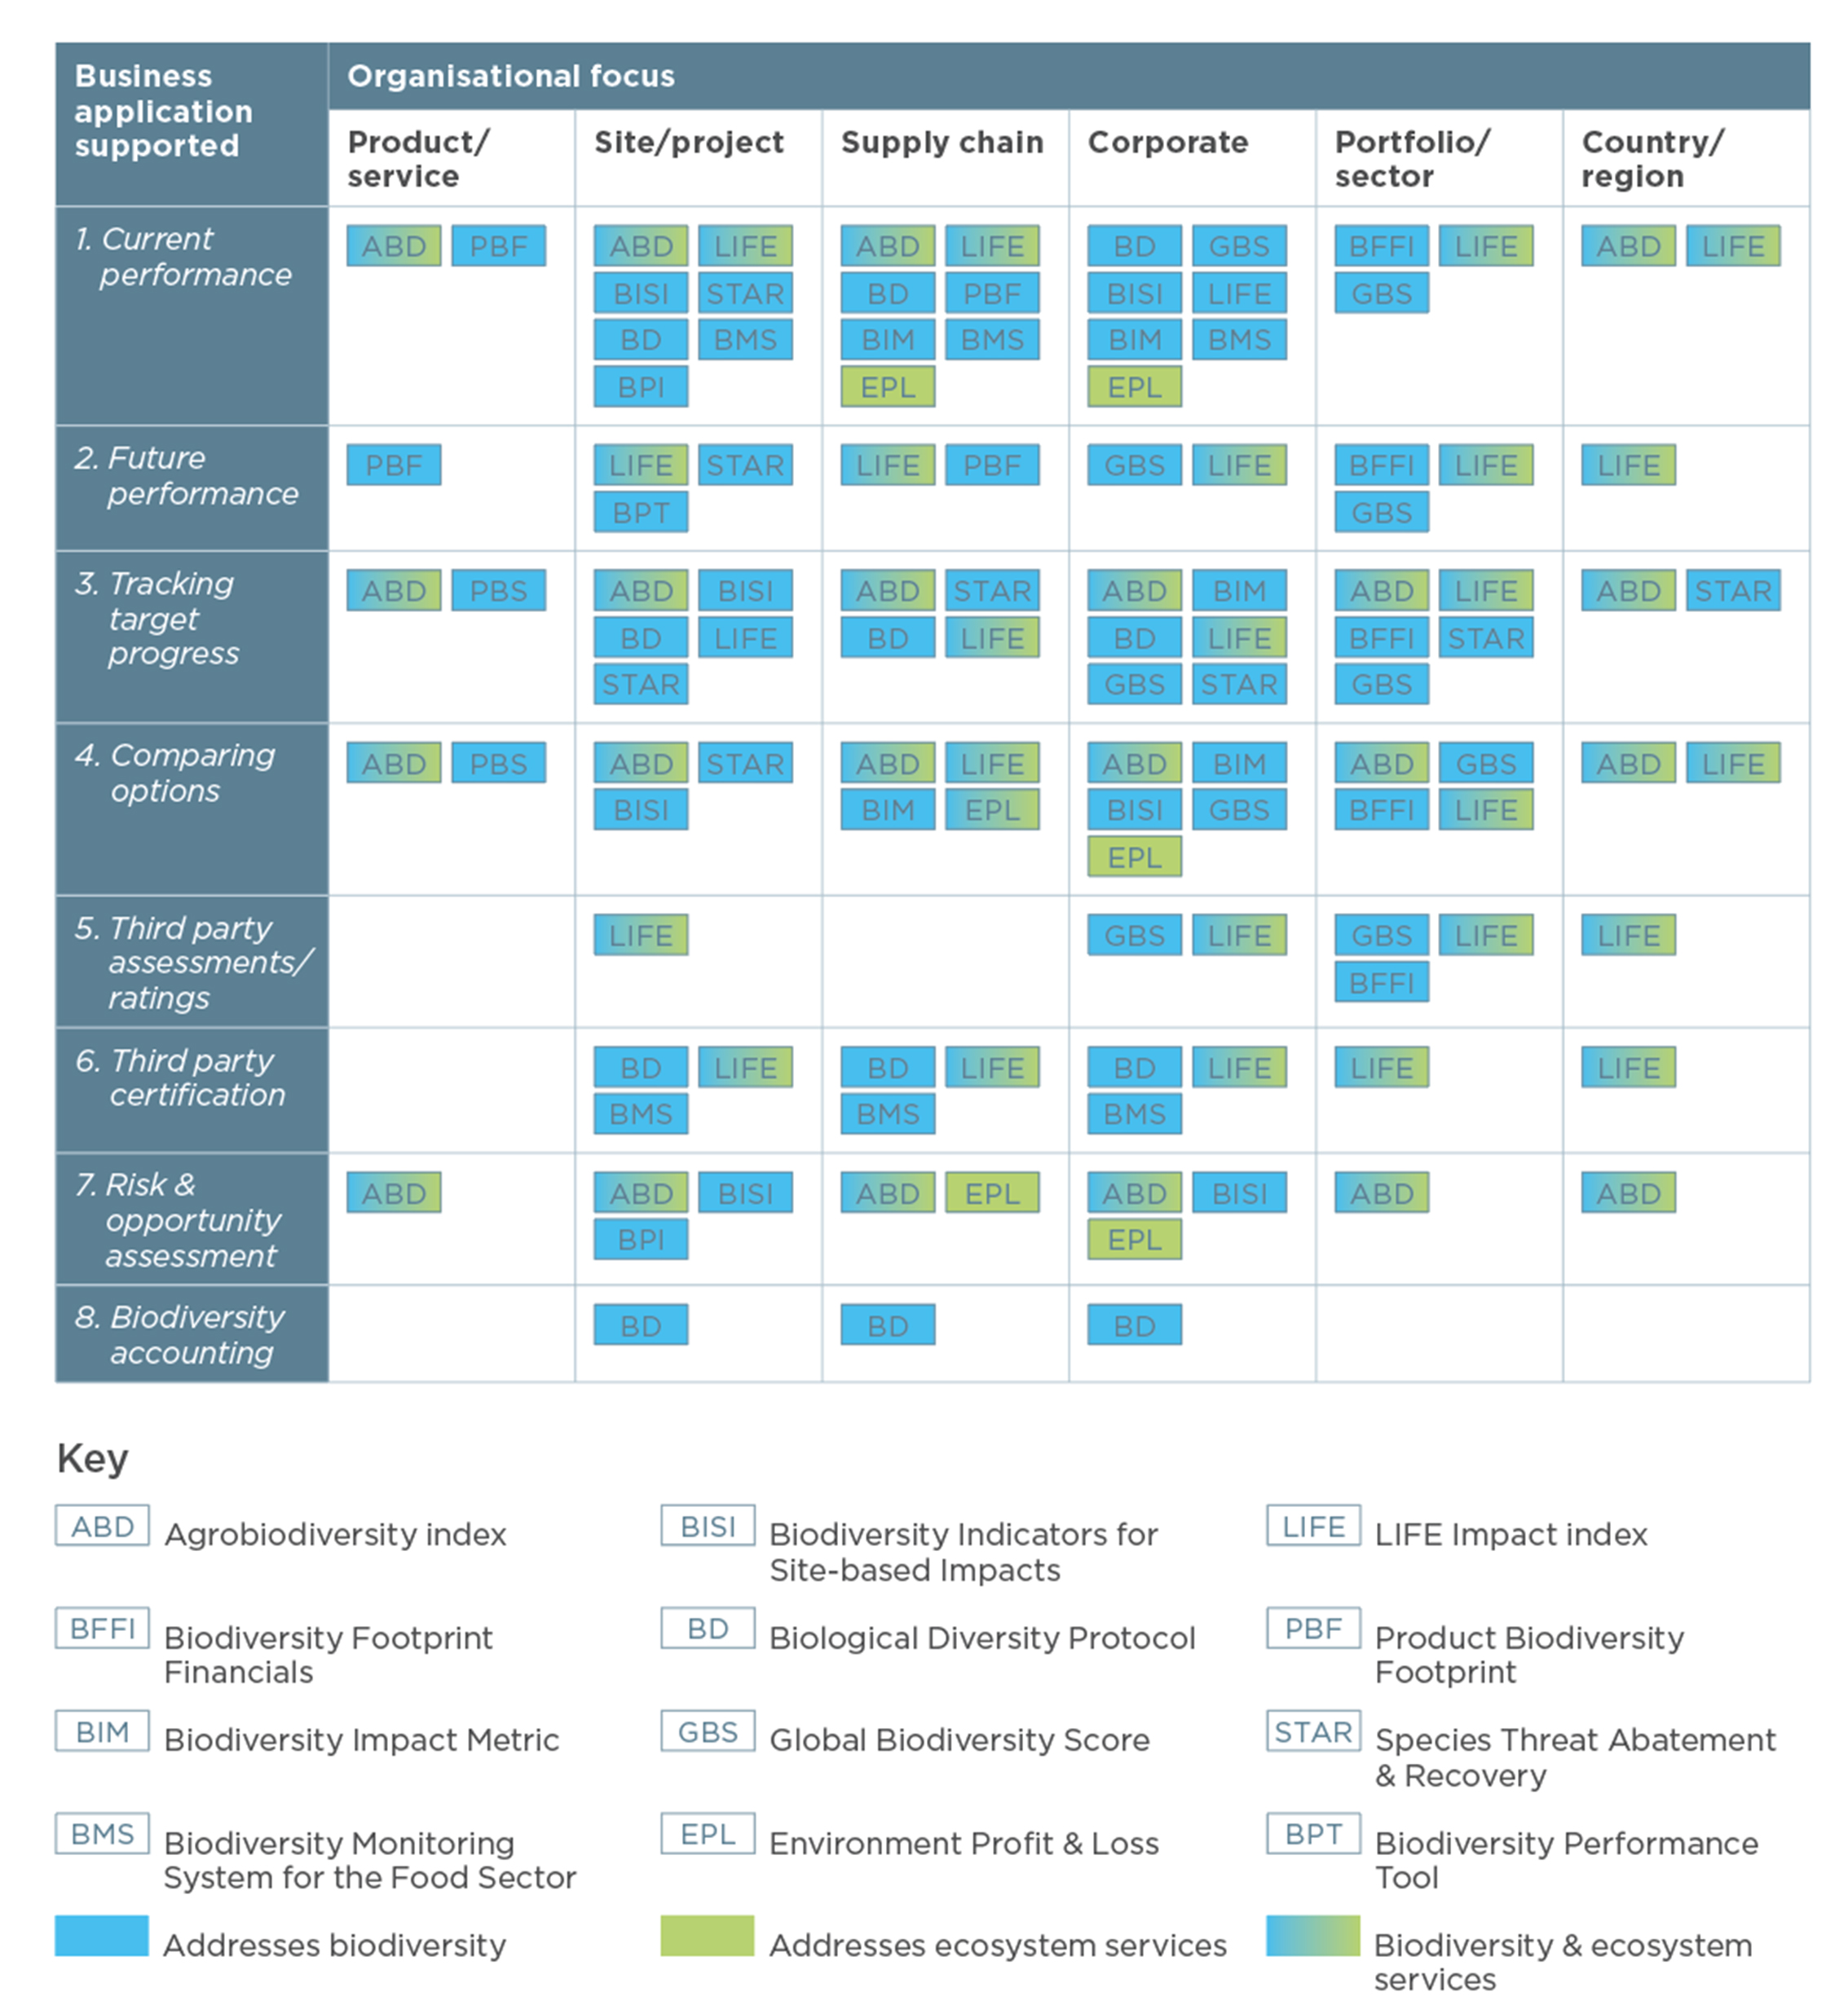
Source: EU Business @ Biodiversity Assessment Update Report 2 (2019). The approaches identified in the matrix were self-reported and will be updated through further developments of the Aligning Biodiversity Measures for Business collaboration.
The categorizations of measurement approaches as relevant to various Business Applications and Organisational Focus areas (figure 6.1) are indicative and self-reported by method developers. The indicated approaches may not be applicable for all specific decisions requiring biodiversity measurement.
Once an applicable measurement approach has been selected and reviewed, it is important to consider the different datasets and associated metrics required. The method chosen will dictate what input data are needed, the level of granularity, and the information gained once measurement is completed. Different underlying metrics are described in detail under action 6.2.5.
Once measurement approaches have been used to quantify biodiversity impacts and dependencies, this information can then feed into the next step of valuation. Progression from measurement to valuation is helpful to understand the relevance and magnitude of your impacts and dependencies on biodiversity in your business context. There are a variety of valuation approaches available (qualitative, quantitative, and monetary) all of which have advantages and disadvantages, refer to action 7.2.3 for more details. No single approach can fully capture the value of biodiversity or communicate its complexity. Multiple valuation approaches can be used to complement each other. For example, where monetary techniques are unable to capture certain aspects of biodiversity, qualitative and/or quantitative approaches can be used to complement (or instead of) monetary valuation.
See below how a financial institution has reviewed biodiversity measurement approaches to assess their applicability for a portfolio-level biodiversity-inclusive natural capital assessment.
Company example: Finance (asset management)BNP Paribas Asset Management completed an initial piloting of the Measuring Guidance to 1) determine the measurement approaches available to a financial institution completing a portfolio-level natural capital assessment, and 2) complete a gap analysis and identify the pros and cons of each measurement approach identified. The assessment of biodiversity measurement approaches revealed the importance of combining approaches to address some of the existing information gaps associated with different measurement approaches and ensure a comprehensive assessment that fully encompasses biodiversity.
After reviewing the actions outlined within the Measuring Guidance, the Aligning Biodiversity Measures for Business matrix (figure 6.1) was used to identify the measurement approaches most relevant for corporate and portfolio assessments. The approaches identified were the Global Biodiversity Score (GBS), the Biodiversity Footprint for Financial Institutions (BFFI), and the LIFE index. These approaches were chosen based on their ability to support corporate and portfolio-level assessments.
Additional measurement approaches were assessed based on their ability to resolve limitations of the primary approaches. These approaches included the Species Threat Abatement and Restoration (STAR) metric and the Biodiversity Impact Metric (BIM). The TRASE tool was also considered.
In the context of this pilot, it was identified that a combination of approaches is needed to cover the spectrum of biodiversity goals. For example, combining the STAR and Global Biodiversity Score measurement approaches would capture information relating to species extinction and ecosystem integrity. BFFI and GBS are similar in their methods and data requirements—however their applicability is heavily dependent upon the objective of the assessment, highlighting the importance of using the online Biodiversity Guidance Navigation Tool. The tool is designed to help you understand what you need to analyze and why (based on your overall objective) as these are the most important factors when deciding which measurement approach to use. The Scoping Guidance is an important resource for determining which approaches should be further explored.
Where financial institutions hold large portfolios of companies, biodiversity assessments can be complex and time consuming. To fully assess and compare companies in a portfolio, a standardized approach for biodiversity measurement is considered necessary, but it is recognized that using a single measurement approach will not allow for a comprehensive understanding of the impacts and dependencies on biodiversity. Similarly, in assessments identifying impacts and dependencies on biodiversity at the portfolio level, it is difficult to attribute or allocate the impacts of specific companies within the same area. This is a recognized gap even when using a combination of approaches and requires investigation by measurement approach developers.
Although it is recommended that a combination of measurement approaches be used to better assess corporate impacts and dependencies on biodiversity, users still need to investigate the use of these measurement approaches individually to ensure the assumptions of each produce results that build upon one another and avoid the misinterpretation of data (e.g., through double counting, etc.). Additionally, a measurement approach that works for one company may not be relevant for another. Determining the most viable combination of tools for your specific sector and/or company is important. Ultimately, the combination of approaches is a suggested method to fill current gaps in available approaches, but a more permanent solution will be required.
BNP Paribas Asset Management completed an initial piloting of the Measuring Guidance to 1) determine the measurement approaches available to a financial institution completing a portfolio-level natural capital assessment, and 2) complete a gap analysis and identify the pros and cons of each measurement approach identified. The assessment of biodiversity measurement approaches revealed the importance of combining approaches to address some of the existing information gaps associated with different measurement approaches and ensure a comprehensive assessment that fully encompasses biodiversity.
After reviewing the actions outlined within the Measuring Guidance, the Aligning Biodiversity Measures for Business matrix (figure 6.1) was used to identify the measurement approaches most relevant for corporate and portfolio assessments. The approaches identified were the Global Biodiversity Score (GBS), the Biodiversity Footprint for Financial Institutions (BFFI), and the LIFE index. These approaches were chosen based on their ability to support corporate and portfolio-level assessments.
Additional measurement approaches were assessed based on their ability to resolve limitations of the primary approaches. These approaches included the Species Threat Abatement and Restoration (STAR) metric and the Biodiversity Impact Metric (BIM). The TRASE tool was also considered.
In the context of this pilot, it was identified that a combination of approaches is needed to cover the spectrum of biodiversity goals. For example, combining the STAR and Global Biodiversity Score measurement approaches would capture information relating to species extinction and ecosystem integrity. BFFI and GBS are similar in their methods and data requirements—however their applicability is heavily dependent upon the objective of the assessment, highlighting the importance of using the online Biodiversity Guidance Navigation Tool. The tool is designed to help you understand what you need to analyze and why (based on your overall objective) as these are the most important factors when deciding which measurement approach to use. The Scoping Guidance is an important resource for determining which approaches should be further explored.
Where financial institutions hold large portfolios of companies, biodiversity assessments can be complex and time consuming. To fully assess and compare companies in a portfolio, a standardized approach for biodiversity measurement is considered necessary, but it is recognized that using a single measurement approach will not allow for a comprehensive understanding of the impacts and dependencies on biodiversity. Similarly, in assessments identifying impacts and dependencies on biodiversity at the portfolio level, it is difficult to attribute or allocate the impacts of specific companies within the same area. This is a recognized gap even when using a combination of approaches and requires investigation by measurement approach developers.
Although it is recommended that a combination of measurement approaches be used to better assess corporate impacts and dependencies on biodiversity, users still need to investigate the use of these measurement approaches individually to ensure the assumptions of each produce results that build upon one another and avoid the misinterpretation of data (e.g., through double counting, etc.). Additionally, a measurement approach that works for one company may not be relevant for another. Determining the most viable combination of tools for your specific sector and/or company is important. Ultimately, the combination of approaches is a suggested method to fill current gaps in available approaches, but a more permanent solution will be required.