Explore the resources below to assist in completing this action.
Biodiversity Guidance action 6.2.5
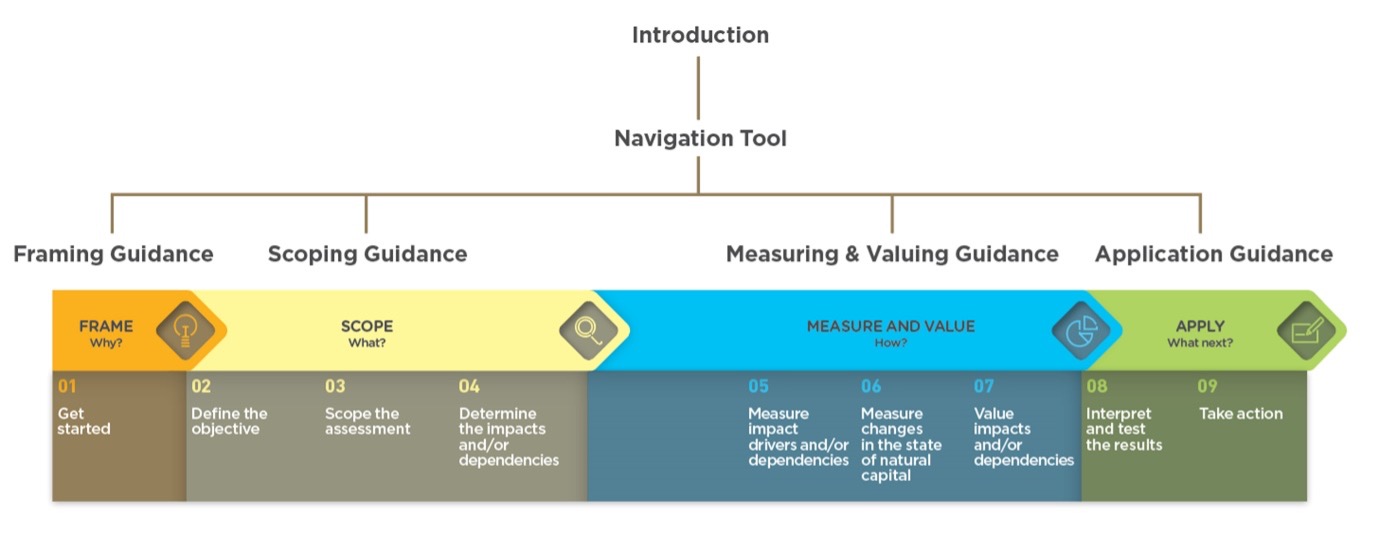
6.2.5 Undertake or commission measurement
The most commonly used metrics underlying biodiversity measurement approaches (in figure 6.1) include; mean species abundance (MSA), potentially disappeared fraction of species (PDF), and the risk of species extinction (e.g., through the Species Threat Abatement and Restoration (STAR) metric) (for a non-exhaustive list see table 6.4). A particular metric may be more applicable depending on the activity or impact driver that you want to assess. Metrics such as MSA and PDF do not capture changes to all aspects of biodiversity, such as genetic diversity or ecosystem diversity. This is a current data gap within biodiversity measurement approaches requiring innovation.
There is a large ongoing effort to develop biodiversity indicators for state actors and public policy decision-making, coordinated by the Biodiversity Indicators Partnership. There is potential for these metrics to be applied by business with additional analysis. For example, the Biodiversity Intactness Index measures the effects of different land use and land use intensities on community composition.
Example Metric | Description | Data used | Level of applicability | Limitations |
Mean species abundance (MSA) | Indicator of biodiversity intactness Considers mean abundance of species relative to their abundance in undisturbed ecosystems (i.e., reference site) Relative abundance giving a value from 0 (completely destroyed ecosystem with no original species) to 1 (species abundance is unchanged) | Often estimated using the GLOBIO model, which aims at assessing scenarios of human-induced changes in biodiversity No weighting factors are applied to different taxonomic groups or to reflect gaps in biodiversity data | Product Project Company
| Does not weight areas by species richness No distinction is made between species with potentially different conservation values (e.g., common vs. Red-listed) Based on modeled data in many instances and requires significant handling before it provides company- or project-level insights |
Potentially disappeared fraction of species (PDF) | Provides indicator of decline in species richness in an area over a time period Larger PDF values indicate a higher level of impact for the activity PDF impact factors focus on the species richness of plants
| Often estimated using the ReCiPe model, which links economic activity to changes in biodiversity Three European data sources used o UK (Crawley & Harral 2001) o Countryside Survey (2000) o Switzerland (Koellner 2003) | Product Project Company | No distinction is made between species with potentially different conservation values (e.g., common vs. Red-listed) Reliant on estimates based on species-area relationship Focused on species richness rather than abundance |
Species and habitat diversity (richness and abundance) | On-the-ground monitoring / measurement of species and habitats determine species richness, abundance and trends over time | Direct measurement Reliance on local datasets | Product Project | Time bound Costly Potential for species measured to vary depending on approaches used |
Risk of extinction (e.g., STAR metric) | Assesses potential reduction in extinction risk gained from removal of threats (such as mining) in a given area | IUCN STAR layer (based on IUCN Red List data) | Product Project Company | Assesses extinction risk to threatened species and does not consider common species |
Presence of protected species and/or protected areas | Screening of sites for the presence of protected species or the location of protected areas, for example through the Integrated Biodiversity Assessment Tool | IUCN Red List data World Database of Protected Areas | Project | Screening potential impacts rather than quantitative measurement |
Most impacts on biodiversity manifest over time horizons that do not match real-time decision-making. Companies need to select appropriate measurement intervals to best address this mismatch. For example, yearly monitoring surveys are likely more appropriate than monthly surveys when assessing response of a mammal population to noise from a power plant. Whereas monthly surveys (likely for a year or more) are most appropriate when looking at changes to water quality in relation to a mine’s effluent.
All measurement methods have limitations, which are important to understand before selecting the most appropriate approach. There is a trade-off when selecting measurement approaches between generality/comprehensiveness and precision/specificity. This trade-off influences the interpretation of assessment results for business decision-making in the Apply Stage (Application Guidance).